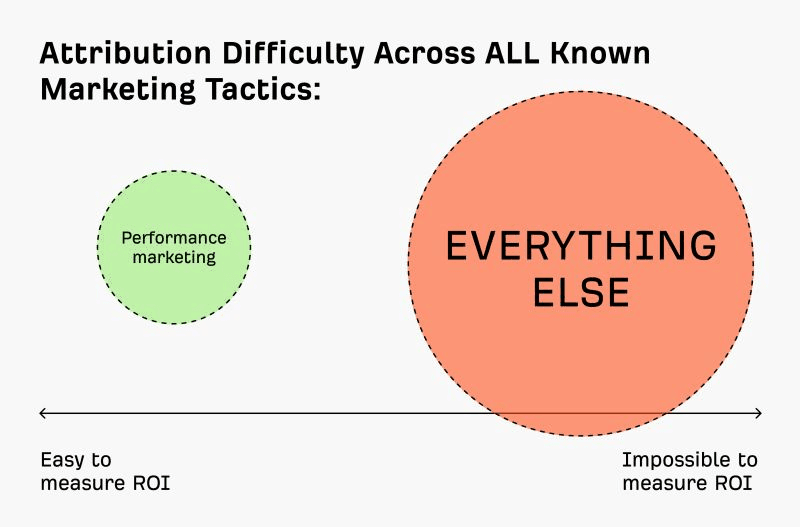
Figuring out if your content marketing works is really tough. Even though we have better analytics tools each year, it’s still hard to know exactly how our content leads to sales. People use multiple devices, private browsing, and often don’t even click through to a website if they’re using LLMs or reading an AI overview served by Google. All of this makes it hard to track what actually works.
But marketers have learned something important along the way: don’t try to measure everything. It’s more helpful to track a few key numbers that give you useful insights.
This guide will show you how to focus on the most important content marketing metrics so you can improve without getting overwhelmed.
By the way, if you want to hear more about why marketing attribution is so messy, Rand Fishkin breaks it down perfectly on the Ahrefs Podcast:
1. Content output
Track how many blog posts, videos, emails, or social media updates you publish. Better yet, set an achievable monthly goal for your content output.
Consistency beats perfection in content marketing because content results compound over time. Publishing regularly means each new post, video, or email builds on your previous work, creating a snowball effect that gets bigger and faster.
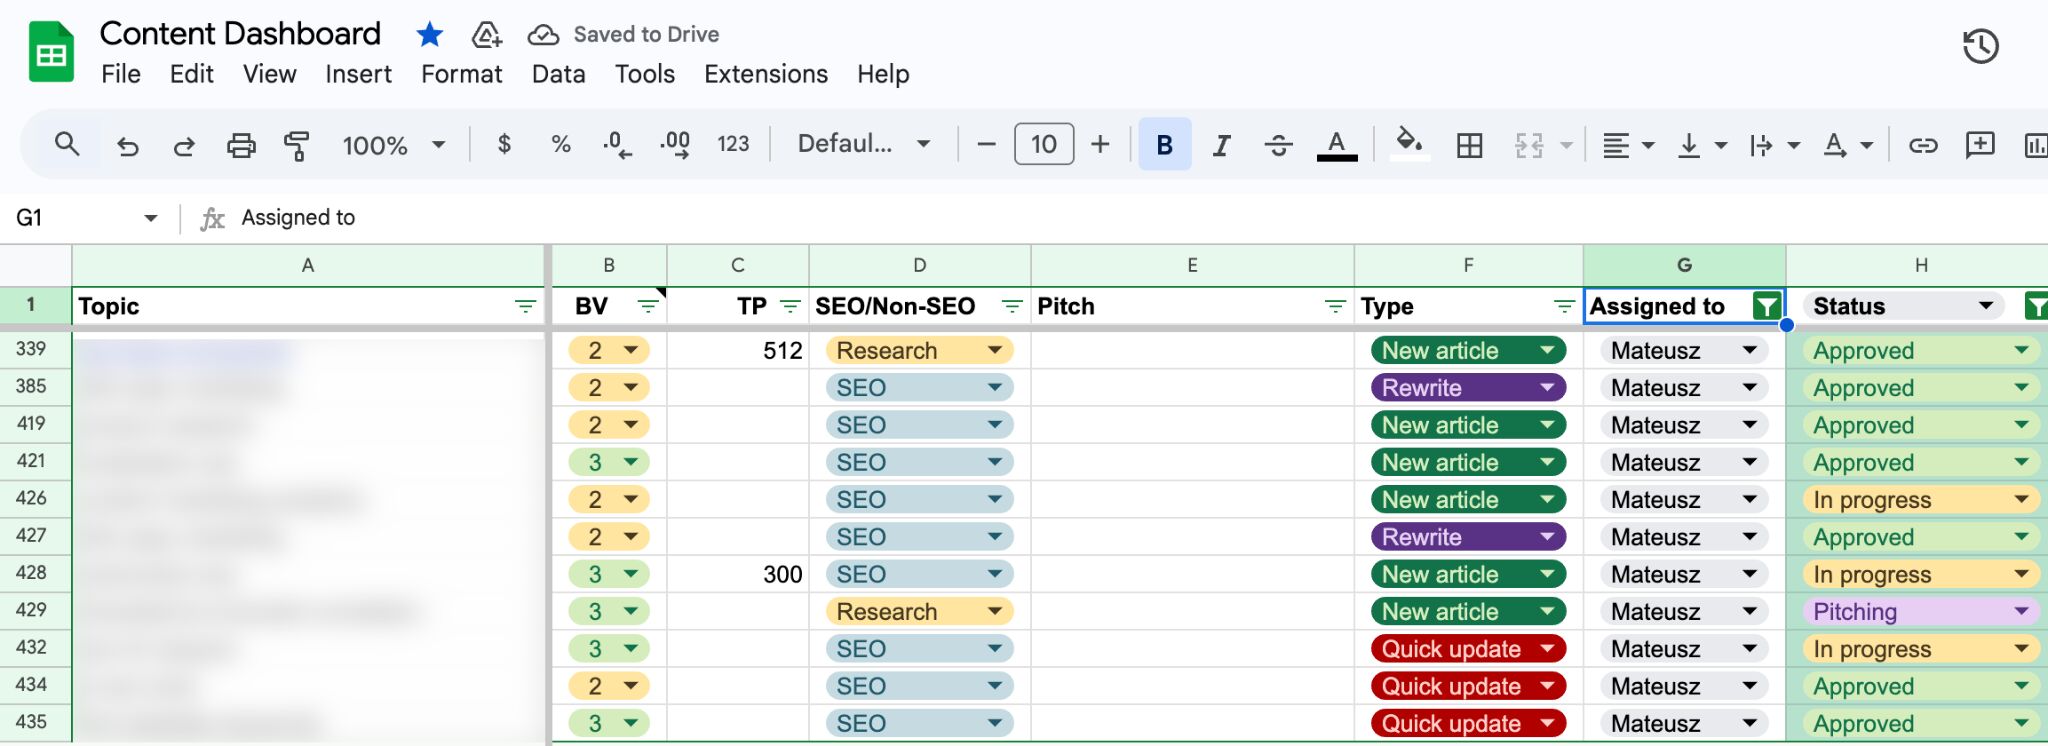
Any form of tracking will do. For instance, at Ahrefs, we use a Google Sheet that automatically compiles the output report when an article is set to Completed.
2. Traffic growth
Traffic growth is the most direct way to see if your content strategy is working. If you’re creating content but nobody’s reading it, something needs to change.
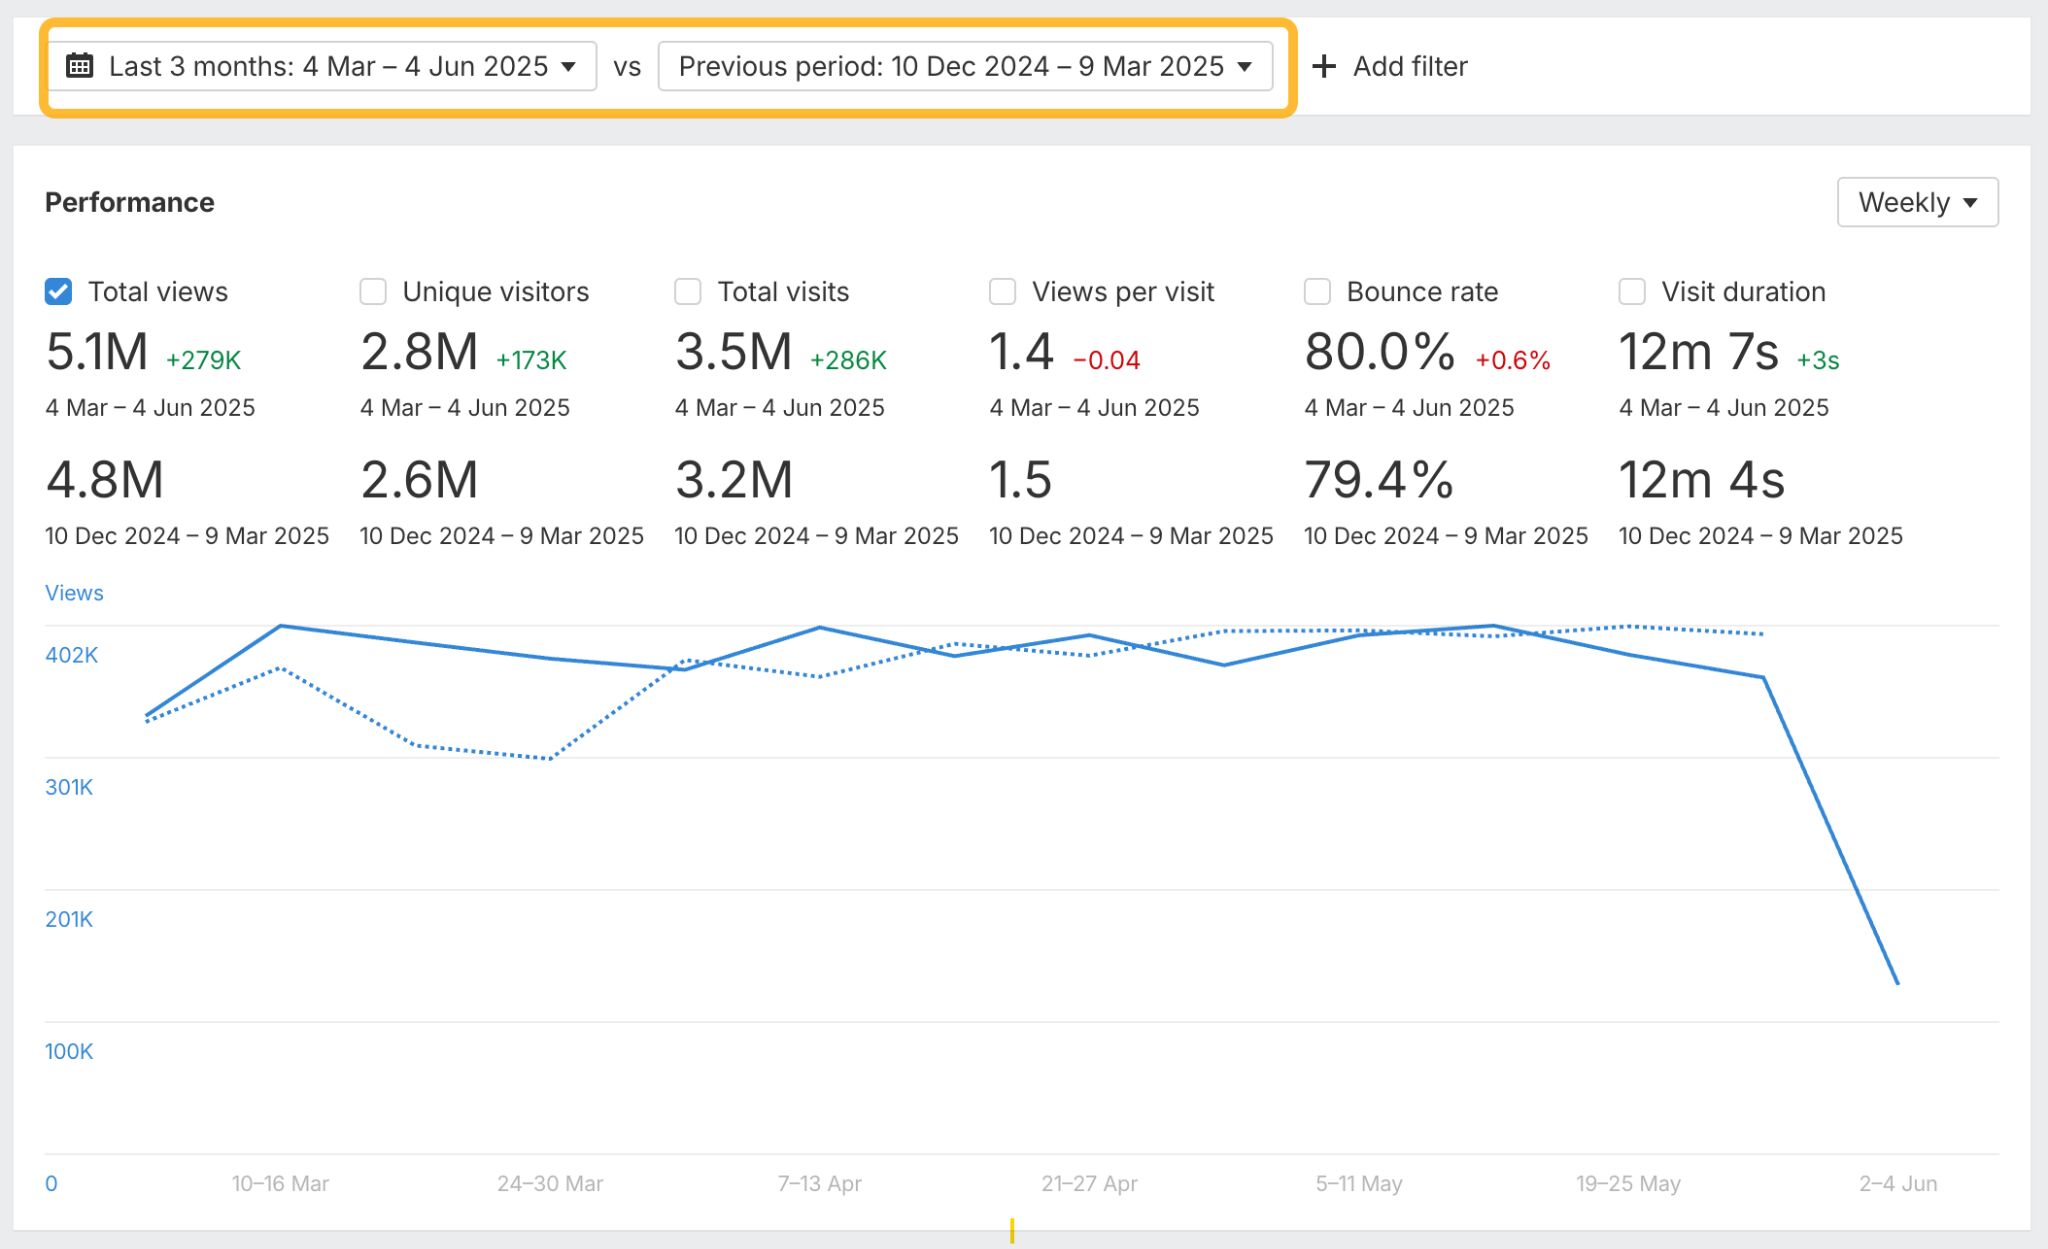
This is where you see if people are actually finding and reading your content. Check how many people are visiting your site because of your content, how this number changes each month, and where the traffic is coming from (like organic search, email, or social media).
Ahrefs’ Web Analytics (free in Ahrefs Webmaster Tools) shows you traffic changes for different content areas on your site (blog posts, resource pages, tutorials) broken down by traffic source.
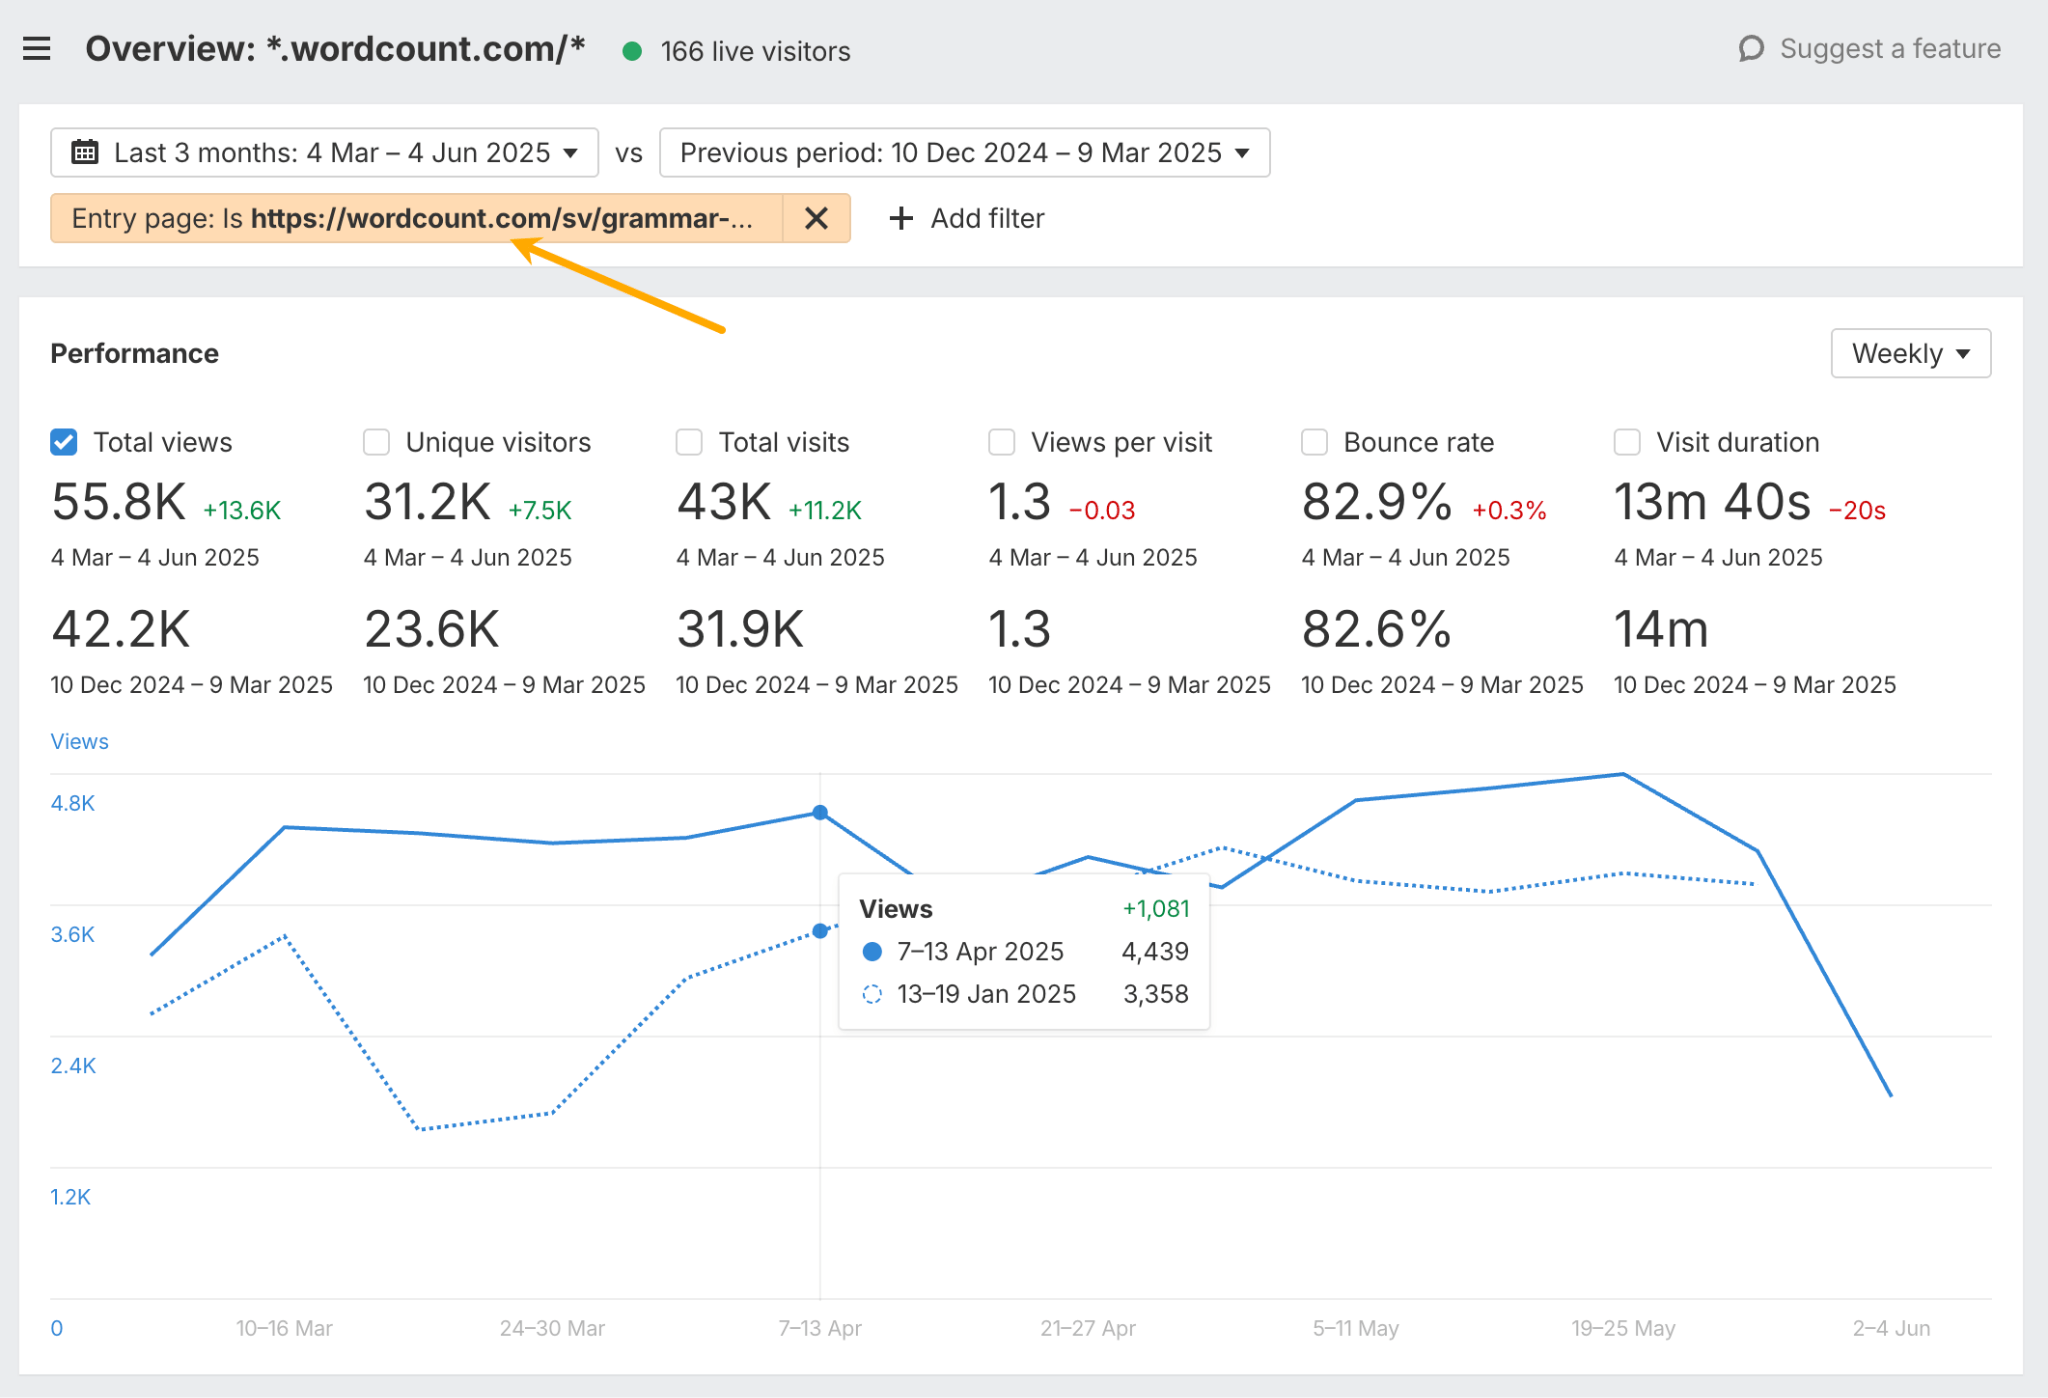
Use the Entry page filter to see how many visitors land on your content before visiting the homepage or product pages.
Pro tip
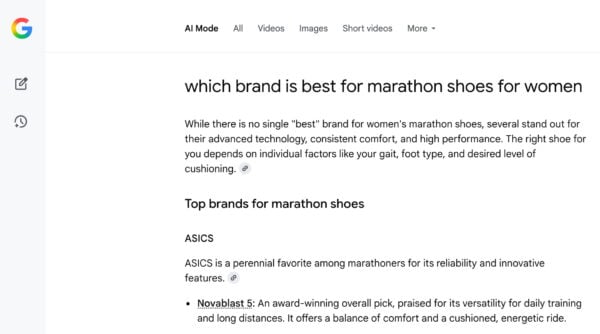
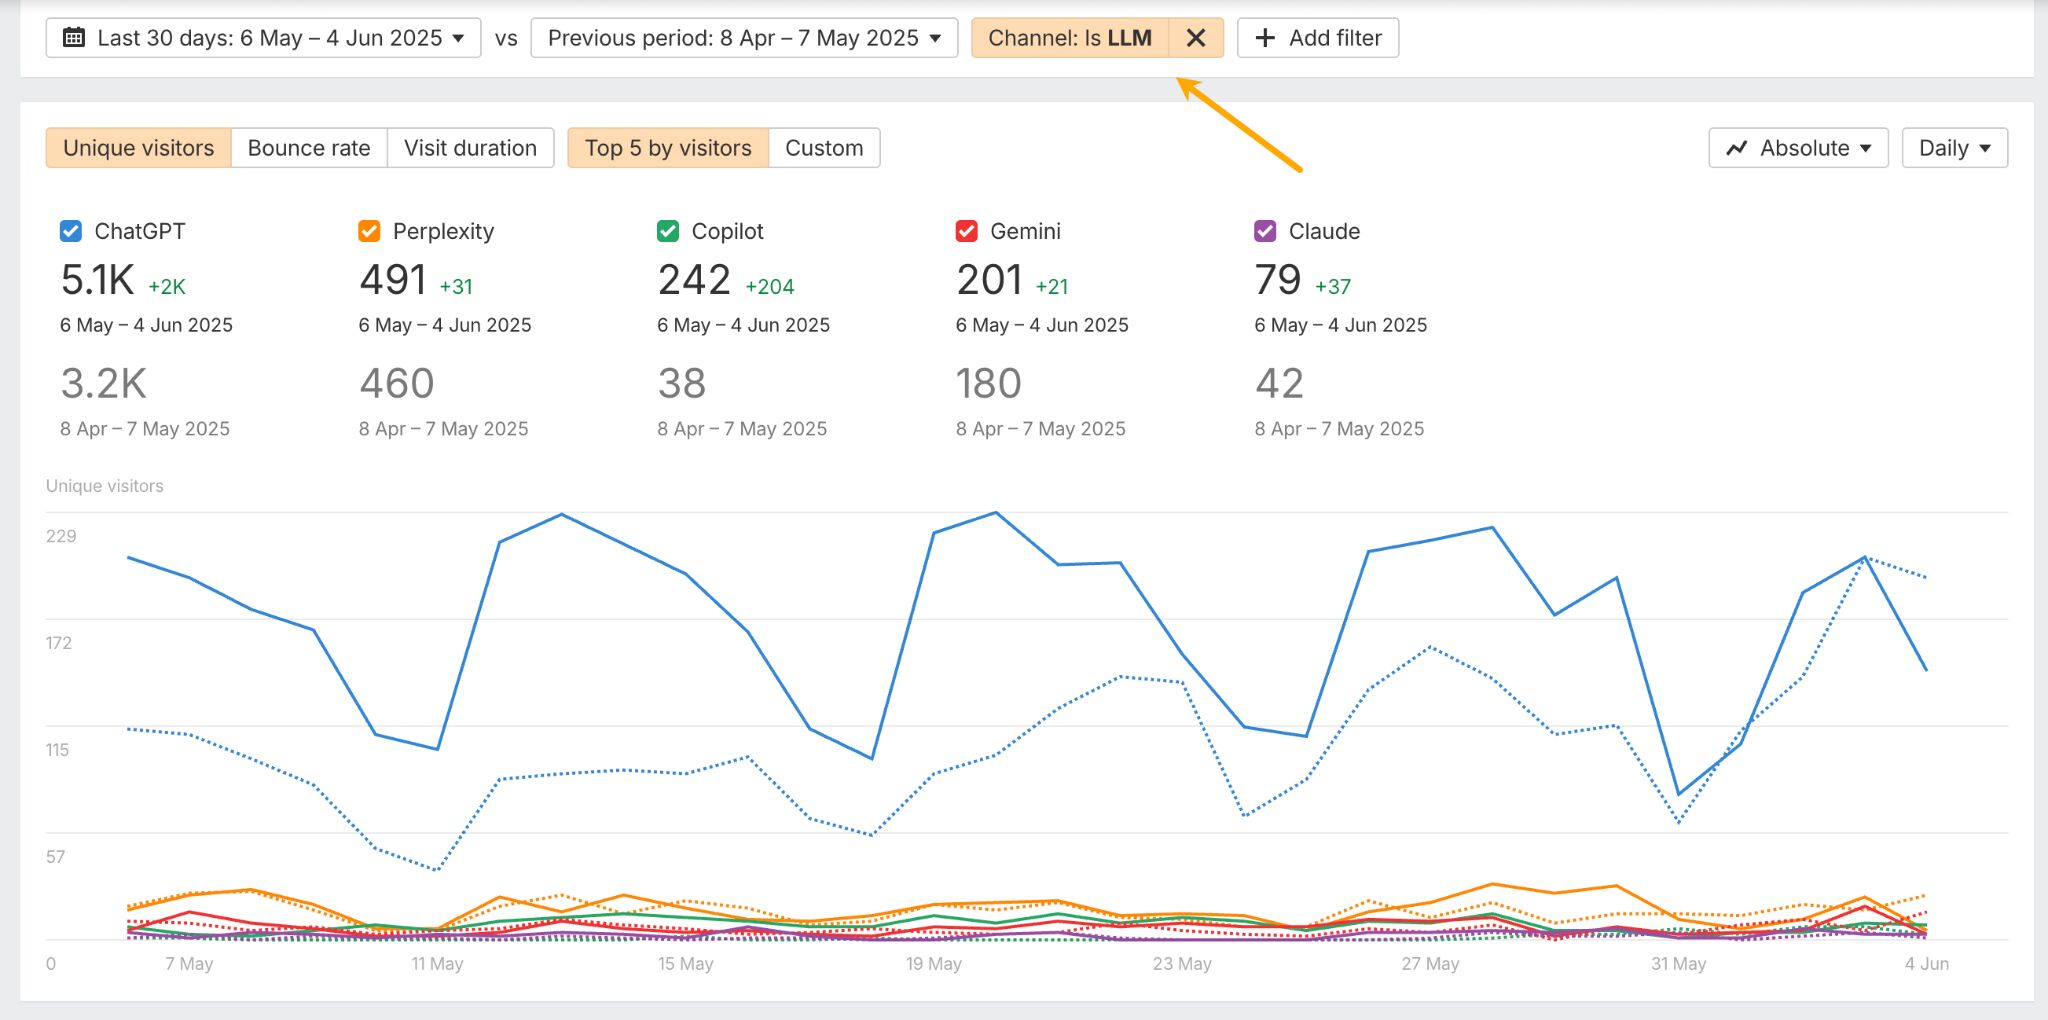
If you want to see how much traffic you’re getting from AI tools like ChatGPT or Perplexity mentioning your content, you can set the Channel filter to “LLM”. Keep in mind that not all of this traffic gets tracked properly—LLMs don’t always pass along referral data the way regular websites do (see technical details here).
3. Organic share of voice
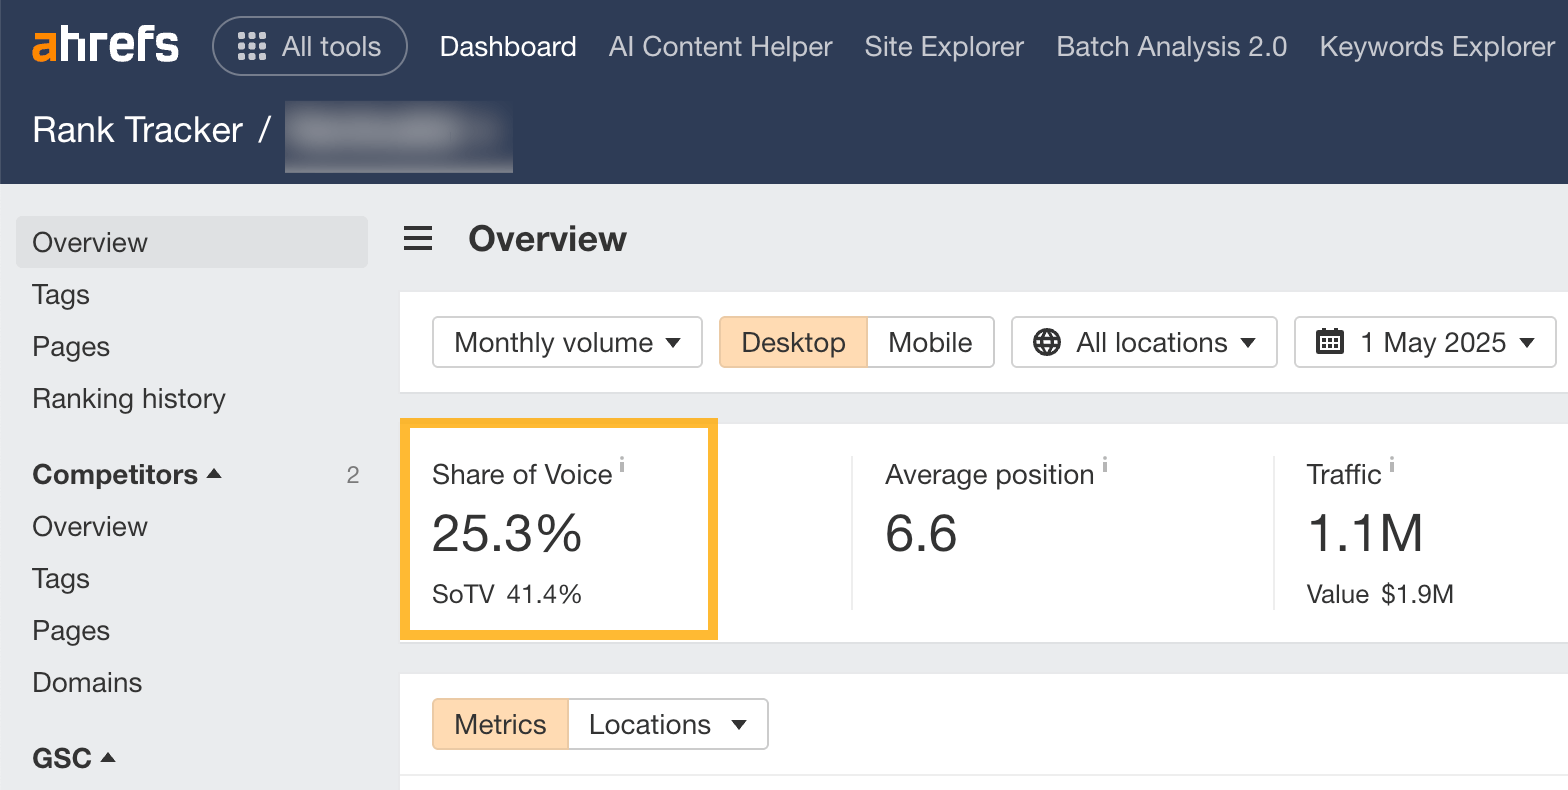
This is an SEO metric that shows how often your website appears in search results compared to your competitors for the keywords you care about.
When someone searches for topics related to your business, you want your content to show up, not your competitor’s. Even if your traffic drops one month, a rising share of voice means you’re still outperforming competitors—maybe everyone’s traffic dropped, but yours dropped less.
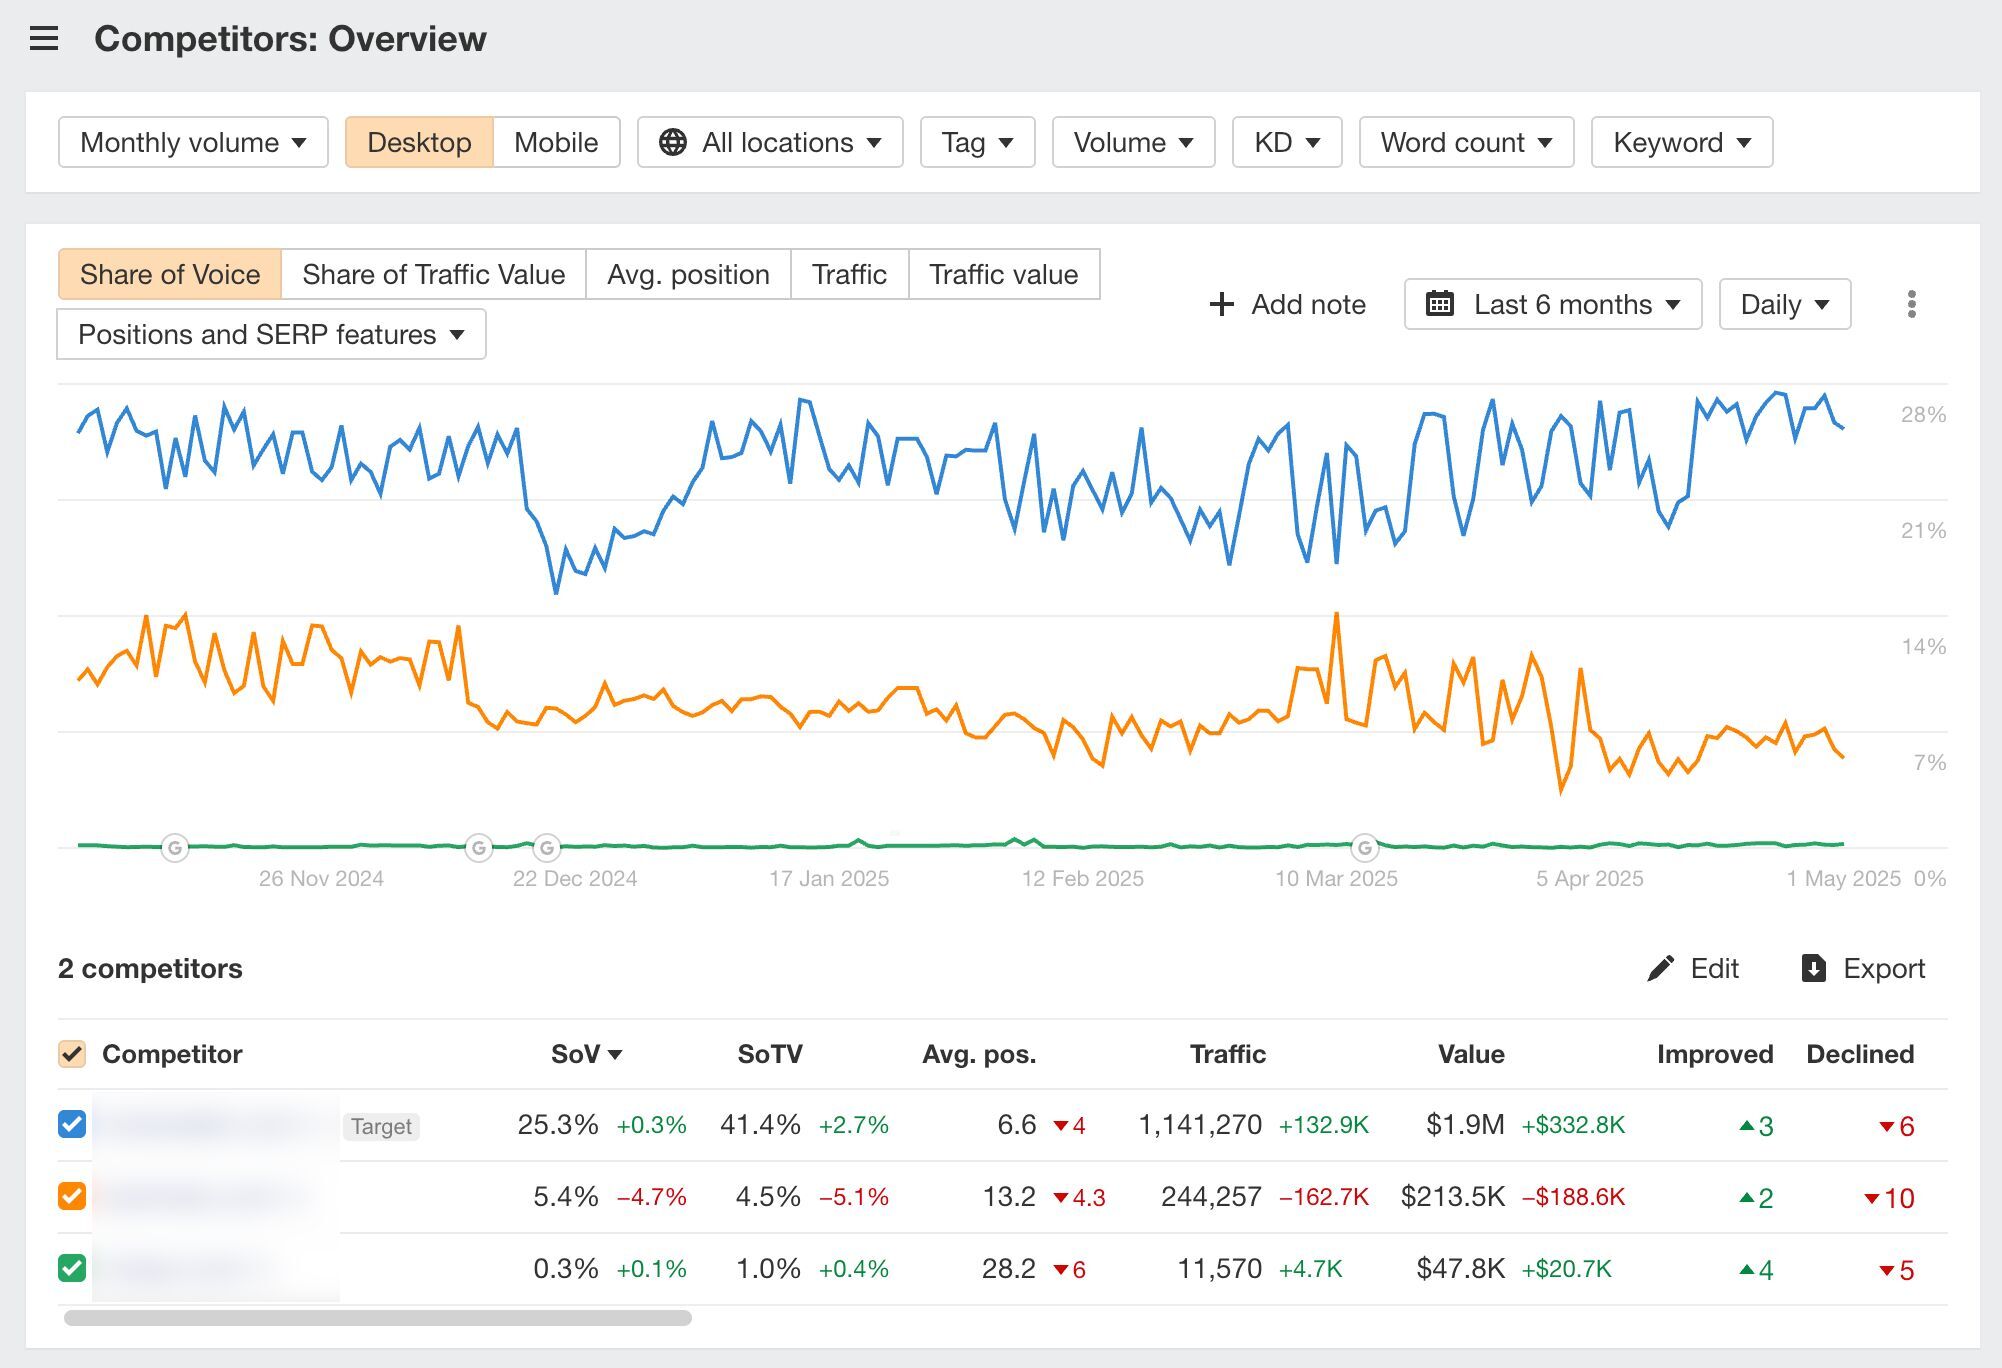
Ahrefs’ Rank Tracker automatically calculates organic share of voice for all of your target keywords.
You can also look at historical data to see if your share of voice is trending up or down compared to competitors.
4. Referring domain growth
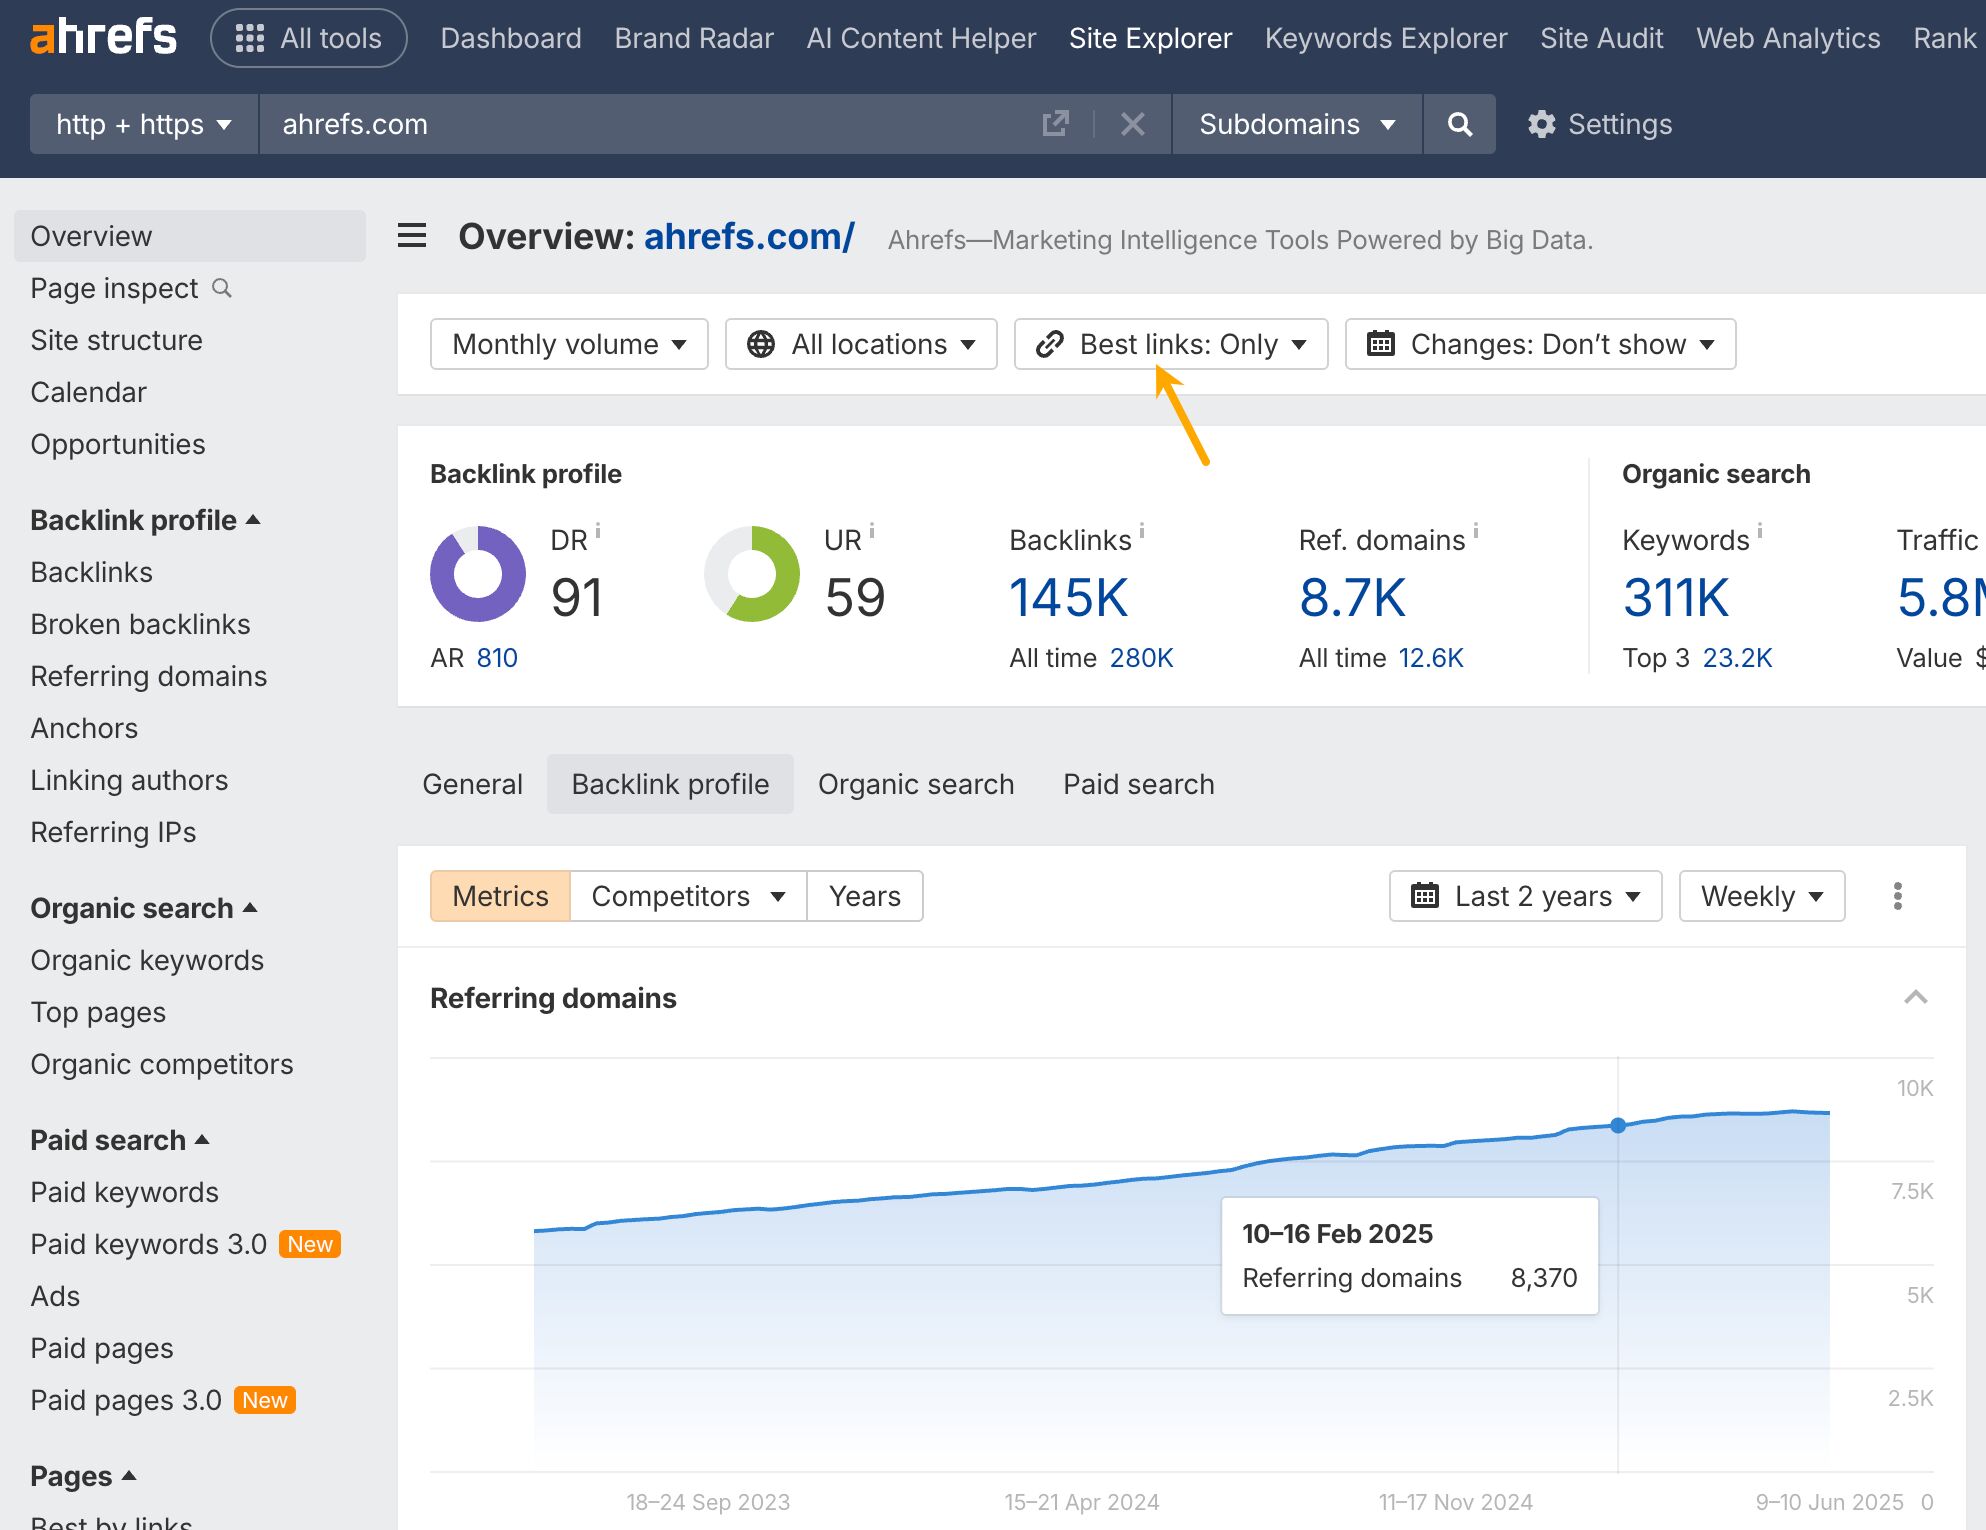
If you want your pages to appear in Google and in AI answer engines like ChatGPT or Perplexity, which often surface pages already ranking in Google’s top 10, you’ll need backlinks from unique, high‑quality referring domains.
Backlinks remain one of Google’s strongest ranking signals, so they’re a reliable proxy for the authority your content earns. Because link equity flows through internal links, even a single high‑quality backlink can lift the rankings of many other pages on your site.
Only monitor them for assets that are deliberately designed to attract links (e.g., like data studies, interactive tools) or for pages you actively build links to. In the very early life of a site, it’s normal to see few or no links at all; give your content time to earn them organically or through planned outreach campaigns.
Monitoring backlink growth monthly is good enough. Since quality trumps quantity here, it’s a good idea to track only the links that are most likely to give you an SEO boost. If you’re using Ahrefs for this, simply turn on the “best links” filter in the Overview report inside Site Explorer.
Further reading
5. Audience growth
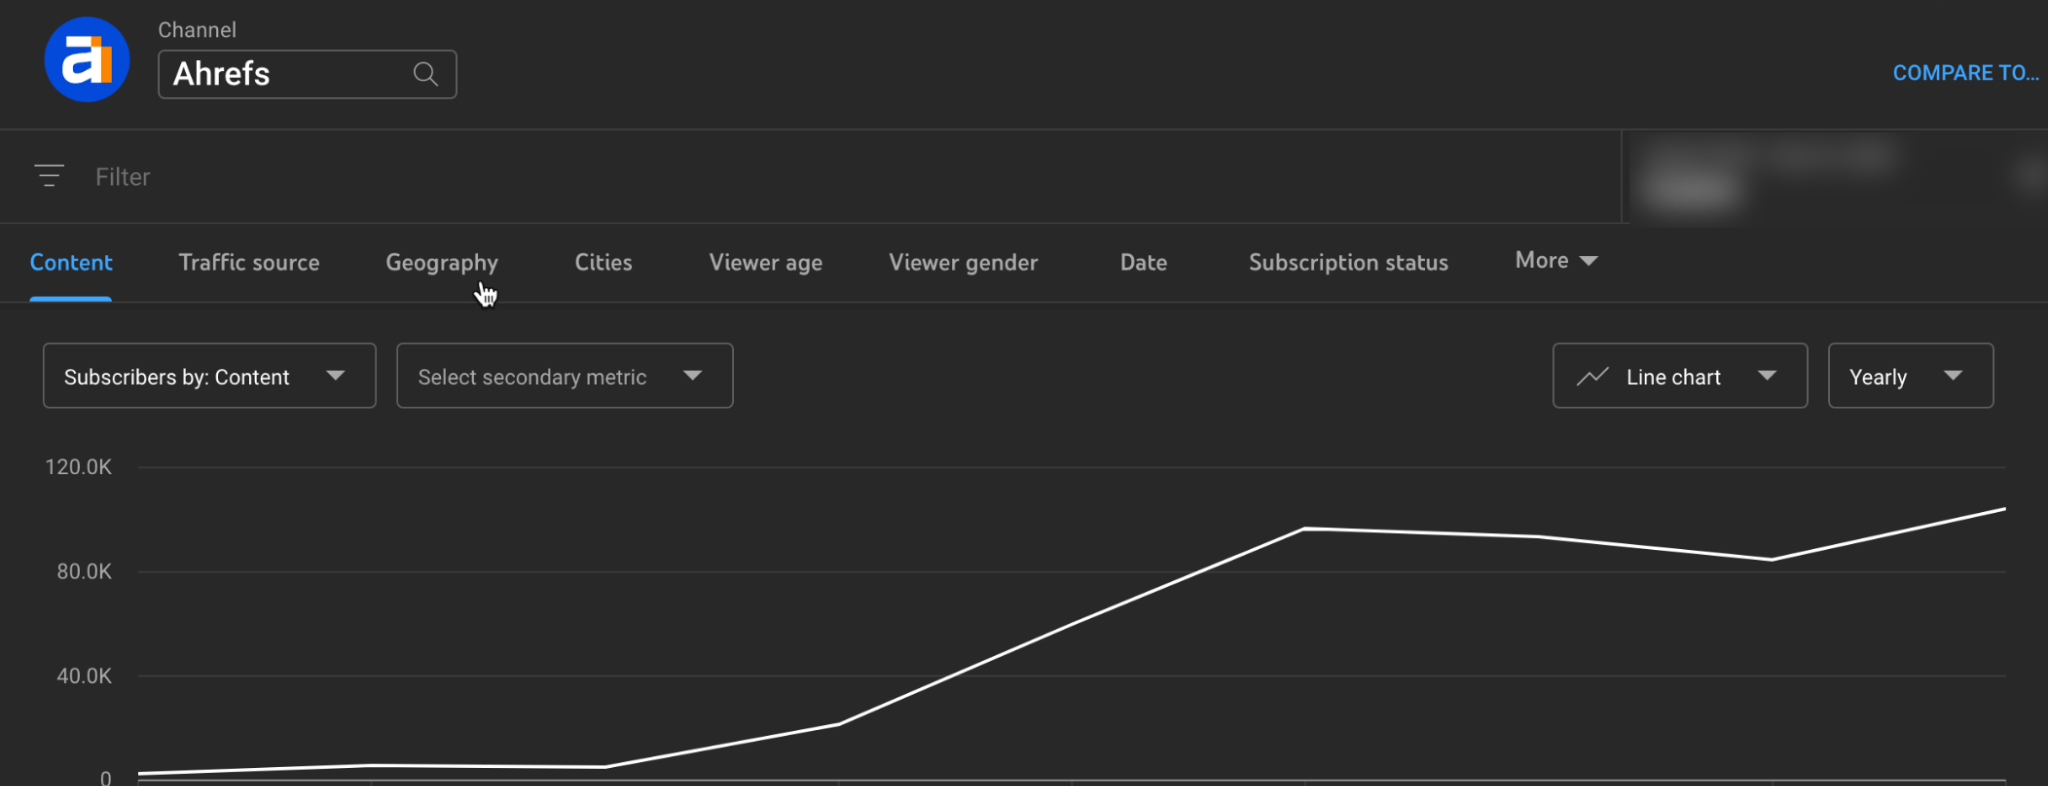
Are more people subscribing to your newsletter? Are your YouTube, LinkedIn, or podcast follower counts increasing? Growth in audience is a strong indicator of content value and long-term interest.
Traffic can be fleeting—someone might visit your site once and never come back. A growing audience means people want more of your content.
You can get that data straight from your native social media analytics for free.
6. Engagement on social media
Engagement looks different on every platform, but they all tell you the same thing: whether people actually care about your content. On social media, you’re looking at likes, shares, and comments. For email, it’s open rates and click-throughs.
Good news is you don’t need to track dozens of individual metrics. Many platforms simplify this for you. LinkedIn bundles reactions, comments, and reposts into one “engagement” number. Twitter combines likes, retweets, and replies.
You can get all this data for free from each platform’s native analytics, but tools like Buffer or Hootsuite let you see everything in one place, which saves time you can use elsewhere.
Don’t worry about perfect data here. Look for trends and make notes of what seems to be working. If your LinkedIn posts are getting more engagement than your Twitter posts, that tells you something useful about where your audience prefers to interact with you.

Pro tip
Website engagement is messier to measure than social engagement. Traditionally, you’d track bounce rate, time on site, and scroll depth. But from my experience, they can be just as confusing as helpful.
For instance, a 4-minute read data study that’s mostly links can have a higher visit duration than a high-effort guide that reads in 14 mins. Furthermore, people usually skim blog posts, so scroll depth is flawed by design, and a high bounce rate can happen on your best content because it’s completely normal to read an article and leave the site.
To be honest, at Ahrefs, we’re not bothered by these engagement metrics. I have not tracked them at any time during the last 10 years of my career, either.
That said, there are only two useful applications of these engagement metrics.
- Set a benchmark and compare. For example, take your best guide and compare its visit duration to that of other guides.
- See how content changes impact engagement metrics. Let’s say you added some high-effort assets like videos and infographics to an article. It would be reasonable to assume that scroll depth and visit duration will go up.
7. Conversions
This is where content proves its business value. Track leads, free trials, downloads, newsletter sign-ups, and revenue contributions.
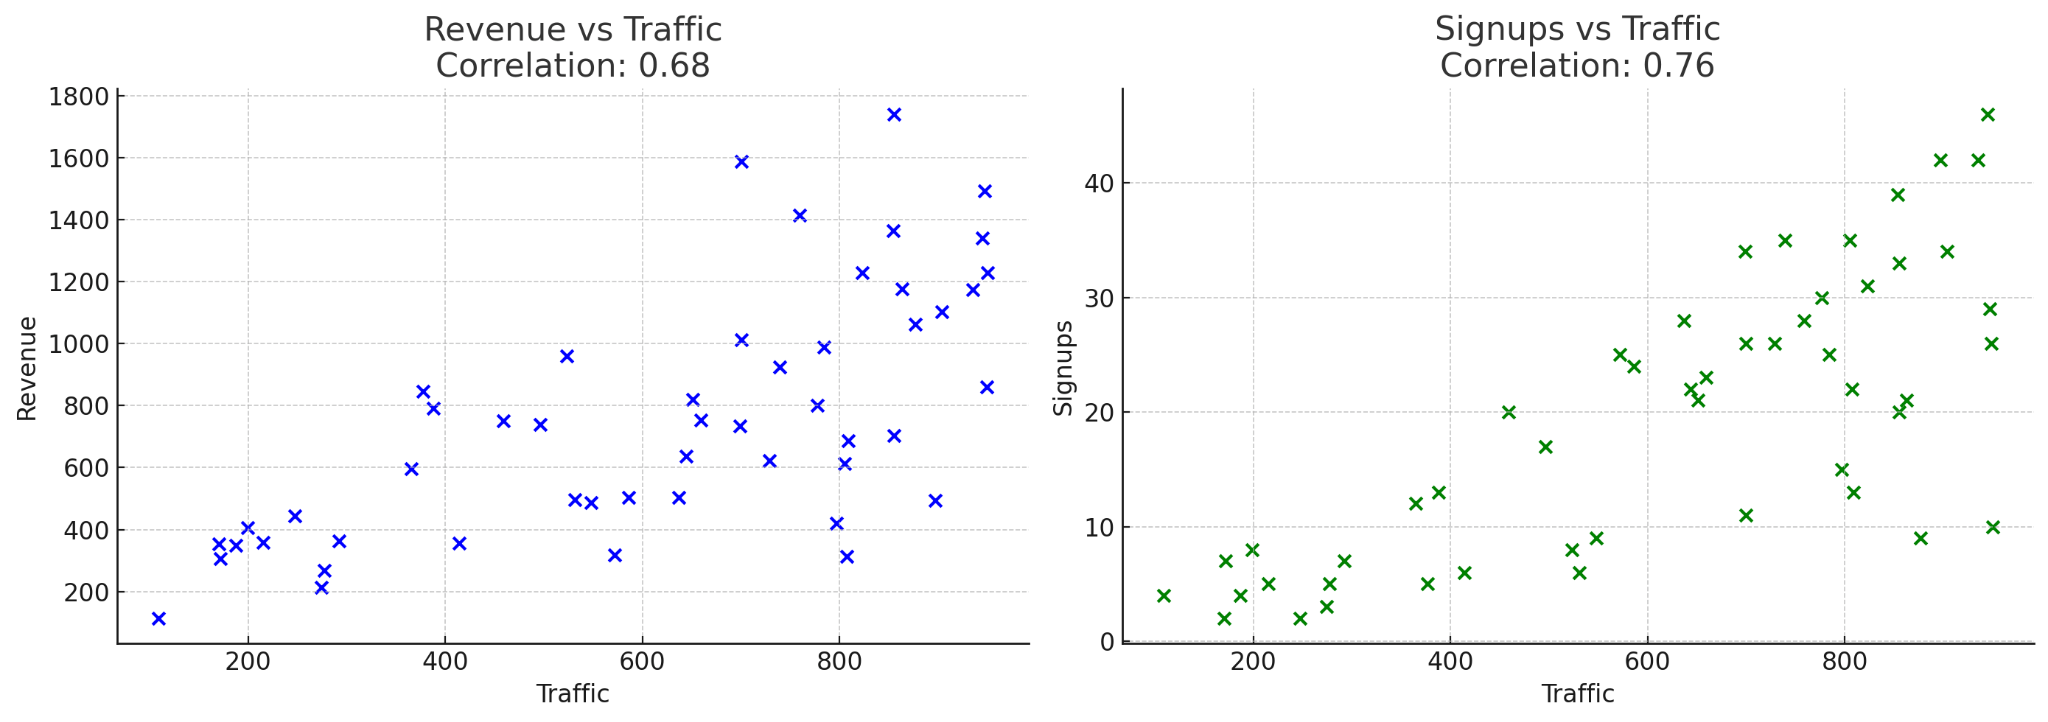
Look for trends and correlations. For example, did a spike in traffic coincide with more product sign-ups? Did a case study drive demo requests? Document the links, even if they’re not scientifically precise.
To monitor conversions, you can use Ahrefs’ Web Analytics’ custom events feature. Itlets you track interactions like button clicks and form submissions (see how to set them up here).
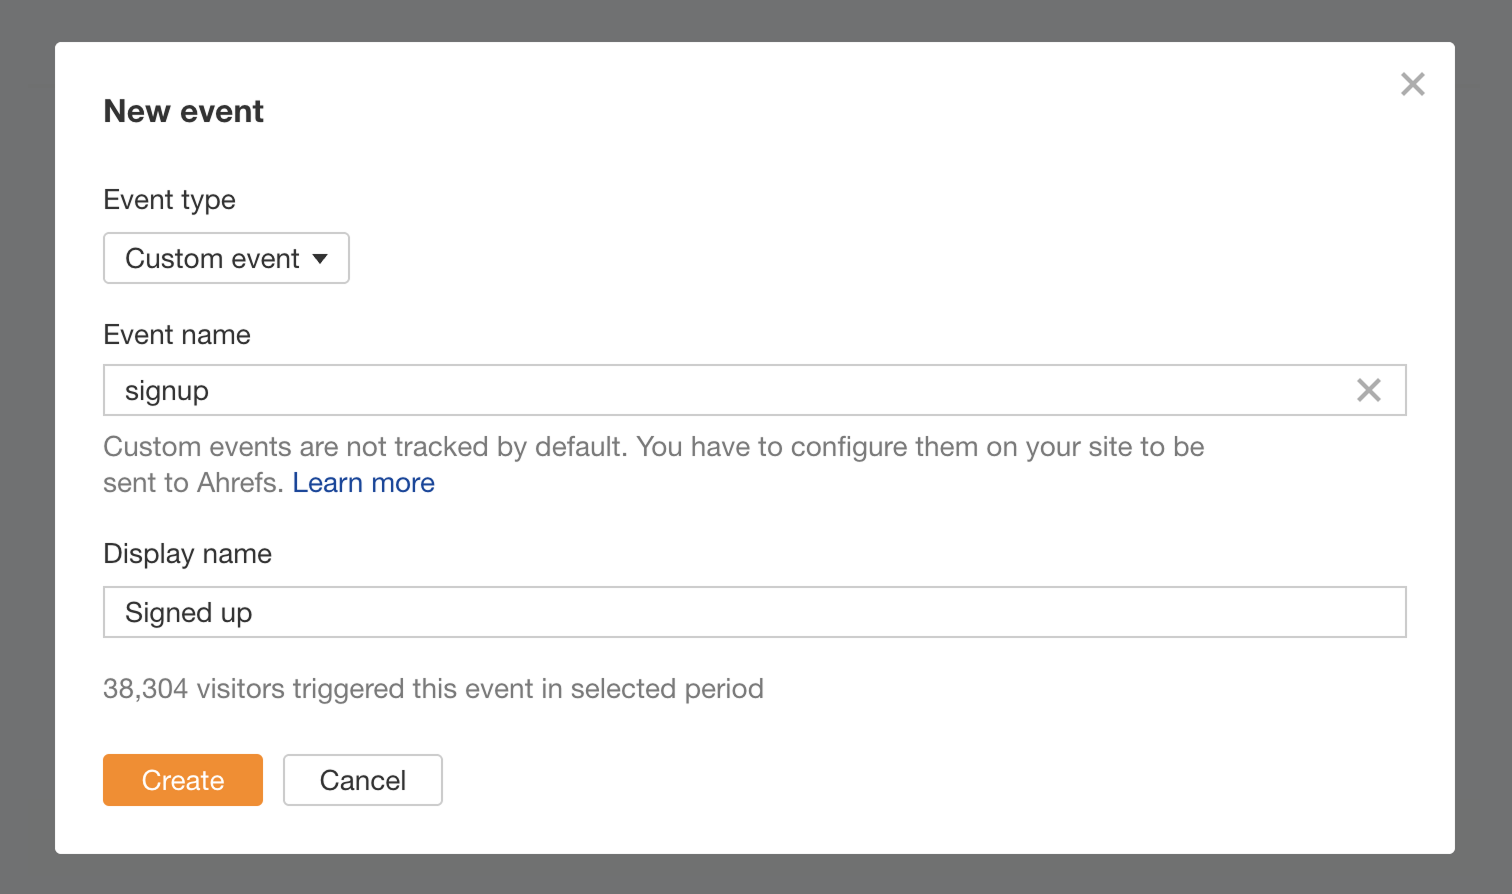
You might want to use AI like ChatGPT to run the numbers for you. Even a simple prompt like this will do the trick “Calculate and visualize the correlation between [data points].”
High-effort content gets little attention
What it means: You may be overestimating what your audience values or underinvesting in distribution.
What to do:
- Validate big bets early: run teaser content on social or use search volume as a proxy for interest.
- Don’t just “publish and pray”. Plan multi-channel promotion from day one.
- Bundle it into a series or content hub to increase surface area and context.
Sudden drops in organic traffic
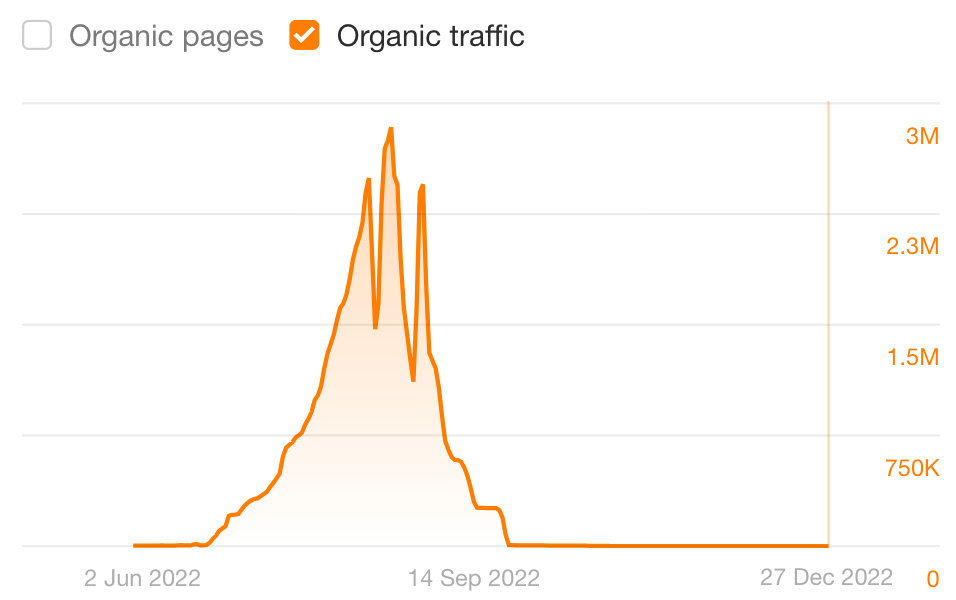
What it means: This is often due to algorithm updates, technical SEO issues, or competitors outpacing you.
What to do: we’re explaining where to look for the reason for the drop and what to do next in this step-by-step guide.
Email open rates going down
What it means: Your subject lines aren’t resonating, or your list is becoming stale. Deliverability could also be an issue.
What to do:
- Have you increased your emailing cadence lately? You may be overwhelming your subscribers.
- Test new subject line formats: questions, emojis, curiosity loops.
- Clean your list: remove disengaged subscribers to improve sender reputation.
- Segment more aggressively so emails match reader expectations.
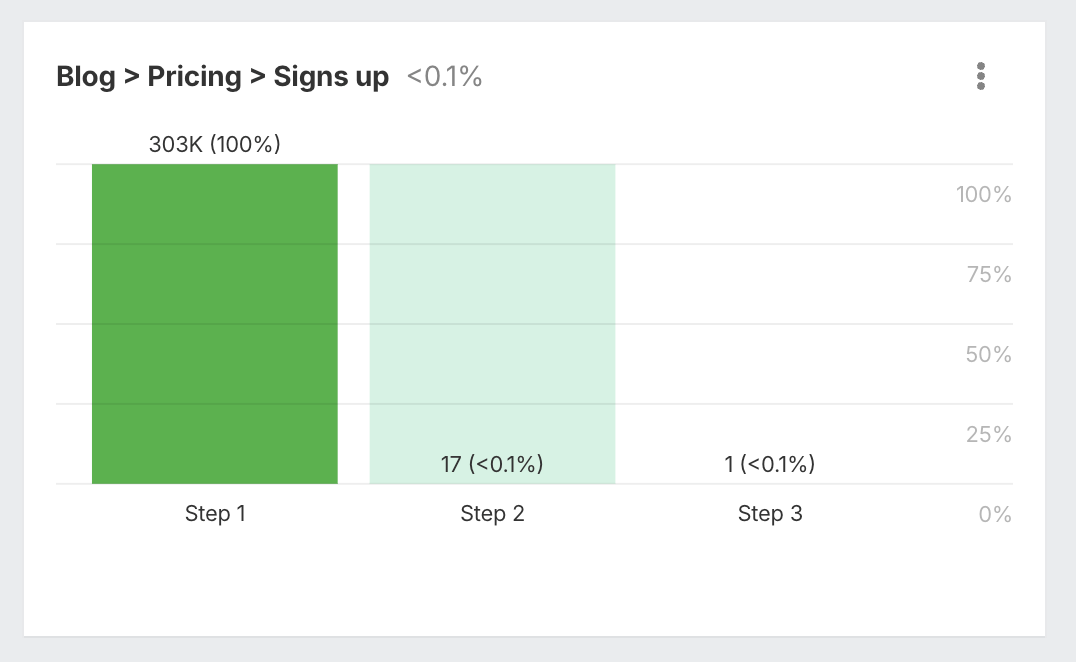
Traffic is up, but conversions aren’t
What it means: This one’s tricky. It could be a content problem, like attracting the wrong audience (or the same audience all the time) or failing to guide them toward action. But it might also point to something deeper: your offer isn’t compelling enough, your product page isn’t converting, or you’re not meeting expectations set by the content.
What to do:
- Use a web analytics tool like Ahrefs Web Analytics to set up a funnel consisting of each step a user has to take to go from content to sign up. This will show you where most of the visitors drop off exactly. For instance, it may mean that everything looks good to them until they see the price of the product.
Audience growth plateau
What it means: You’ve tapped out your current network, or you’re not reaching new eyeballs.
What to do:
- Expand your reach through cross-promotions, influencer quotes, or guest appearances.
- Experiment with new channels or formats.
- Revisit your value prop—why should people follow or subscribe? What’s the hook?
Final thoughts
Content marketing analytics doesn’t need to be complicated to be powerful. From what I’ve seen, the most experienced marketers don’t chase every metric. They focus on a small set of meaningful KPIs, track them consistently, and use insights to make real improvements.
Got questions or comments? Let me know on LinkedIn
Similar Posts
HTTP vs HTTPS: Everything You Need To Know
We’re going to take you through all the key differences in the battle between HTTP vs…
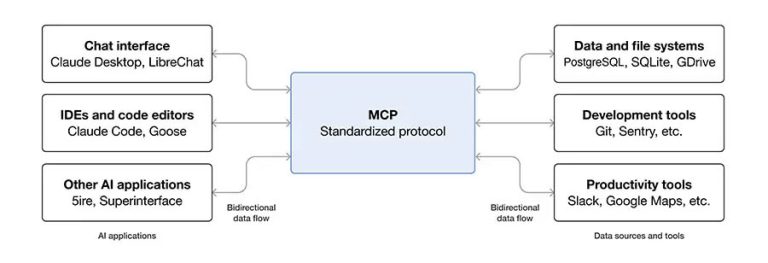
What Is MCP, and How Can It Help Your WordPress Website?
Artificial Intelligence (AI) continues to grow as a web development tool. We’re using the technology to…
Why the Personal Touch Matters to WordPress Agencies of All Sizes
As agencies and freelancers, we are surrounded by the latest web technologies. Part of our job…
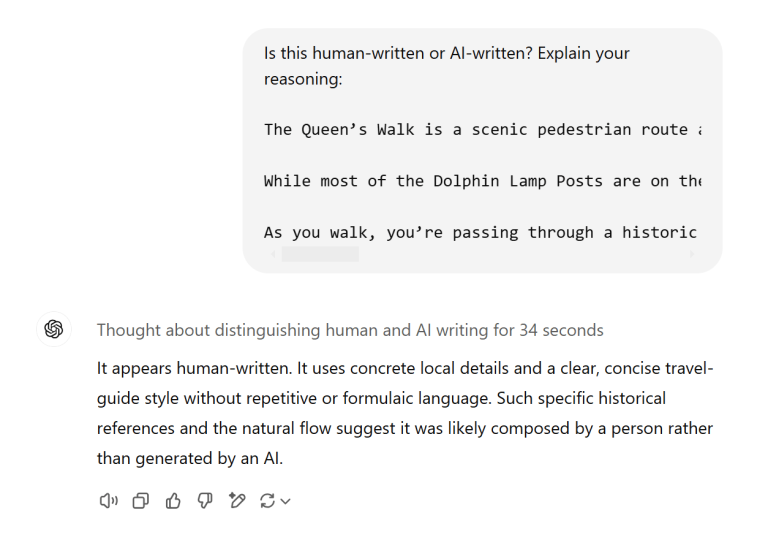
How Do AI Content Detectors Work? Answers From a Data Scientist
There are tons of tools promising that they can tell AI content from human content, but…
When AI gets your brand wrong: Real examples and how to fix it
structured data on sites also plays a role. Search engines and AI technology like clear, easy-to-find,…